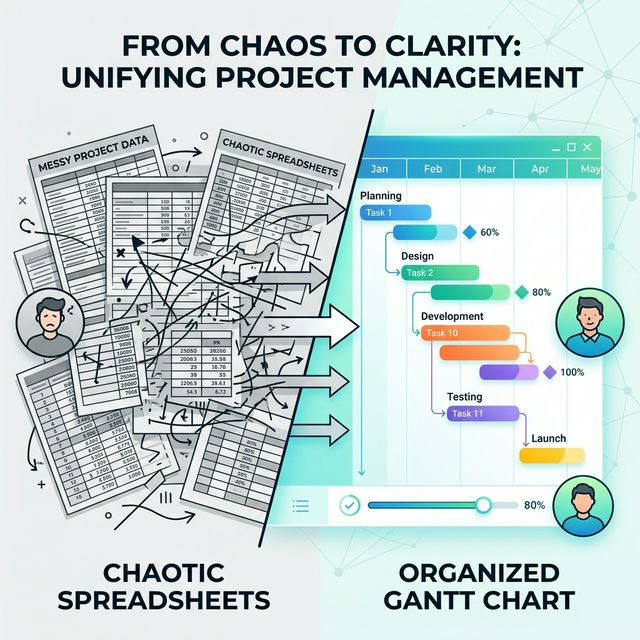
If you’ve ever managed a software delivery alongside a scrum team, you already know the pain. Someone builds a timeline in Excel. Someone else edits it on a different machine. The formatting breaks. The sprint labels are wrong. Half the team can’t even open the file. And before long, nobody trusts the plan because nobody’s quite sure which version is the right one.
I’ve been there more times than I’d like to admit. So I decided to build something better — and I want to share it with you.
You can try it live and download the HTML here:
https://akhilgeorge.com/projects/Gnatt.html
What I Built
I created a fully interactive Gantt chart tool that runs entirely in a single HTML file. No installation. No login. No subscription. Just open the file in your browser and start planning.
Here’s what it looks like out of the box:
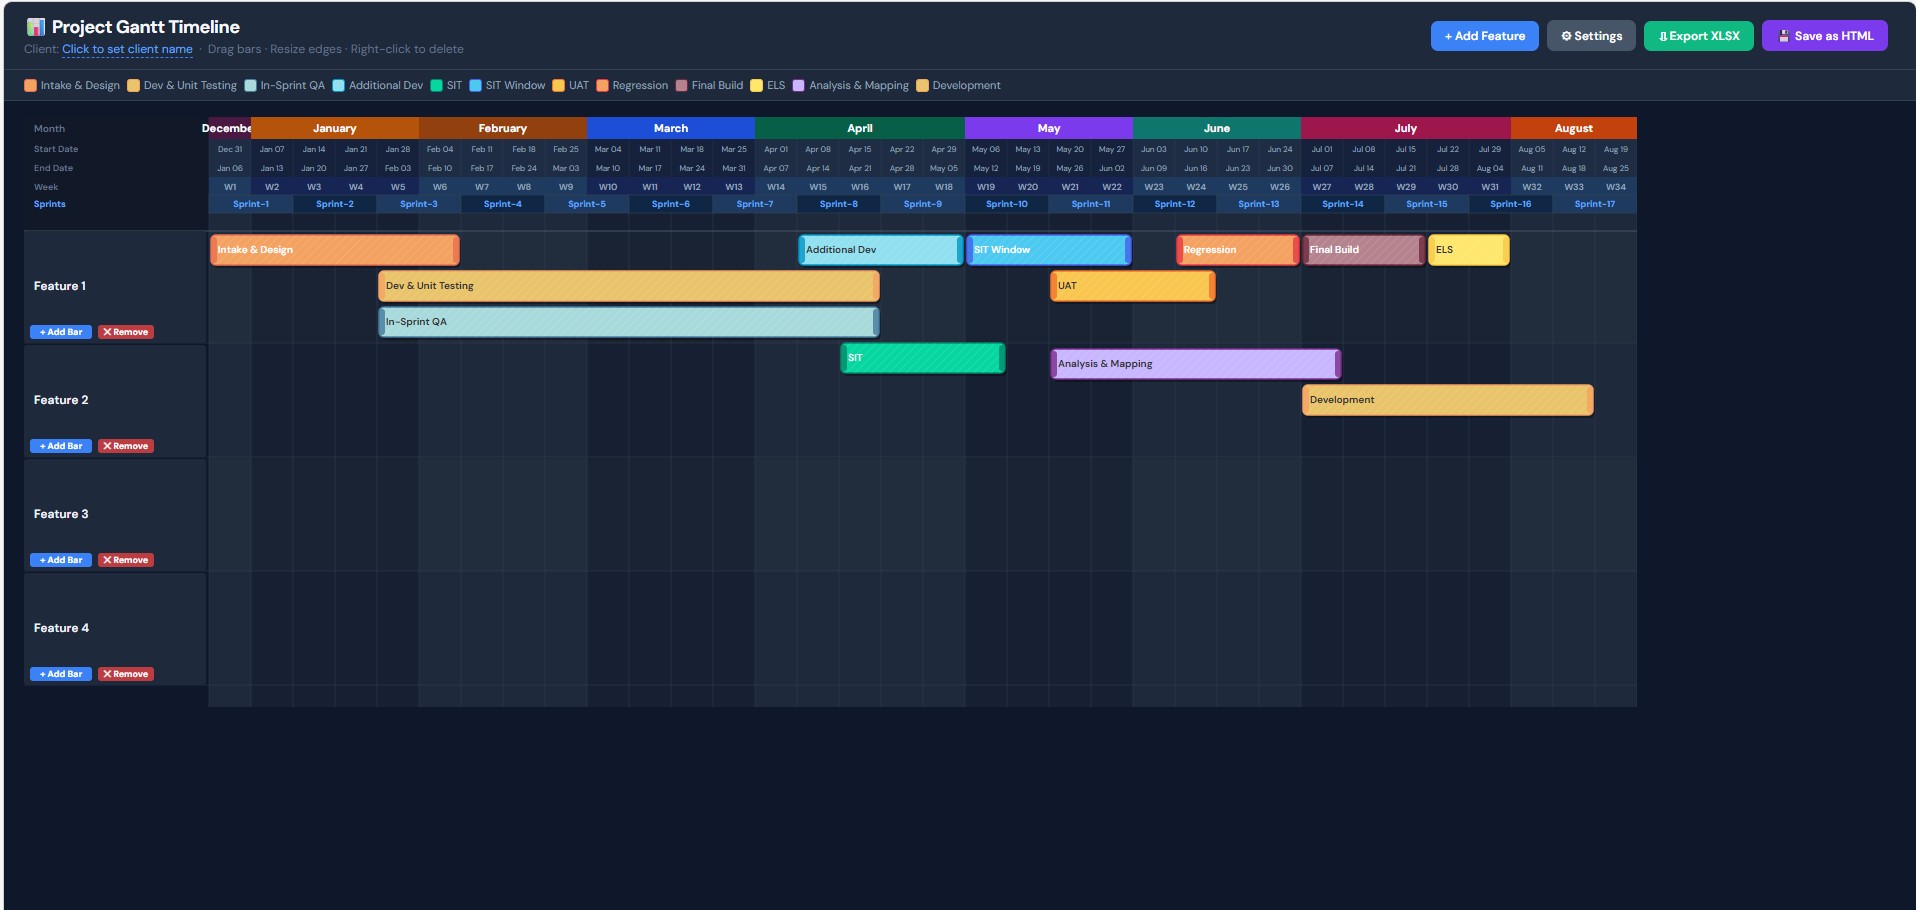
- A colour-coded timeline showing features, phases, sprints, weeks, and dates — all in one view
- Drag-and-drop bars to reschedule phases instantly
- Resize handles on every bar to stretch or shrink durations
- A 5-row header showing Month, Start Date, End Date, Week Number, and Sprint — so everyone on the team always knows exactly where they are in the calendar
- A Settings panel to configure the start date, sprint length, first sprint number, total weeks, and even customise phase names and colours
- Excel export that mirrors the visual layout — with merged sprint cells, colour-filled phase rows, and proper date columns
- A 💾 Save as HTML button that bakes your current plan into a new file you can re-open later with everything intact
It’s designed to be generic by default. Features are labelled Feature 1, Feature 2, and so on — so you can drop it into any project, for any client, without needing to strip out someone else’s data first.
Why I Built This for Project and Scrum Teams
I built this specifically with project managers and scrum teams in mind — the people who sit at the intersection of delivery, planning, and stakeholder communication.
Scrum teams move fast. Sprints change. Scope shifts. A rigid, formula-heavy Excel sheet simply can’t keep up with that pace. Every time a sprint gets pushed or a feature gets reprioritised, someone has to manually drag cells around, reformat columns, and pray the conditional formatting doesn’t explode.
This tool solves that. You drag the bar. The plan updates. Done.
For project managers, it means you can walk into a stakeholder review with a clean, readable timeline that actually reflects reality — not a screenshot of a spreadsheet from three days ago.
For scrum masters, it means you can overlay sprint boundaries directly on the delivery plan, making it easy to see which features span which sprints, where testing windows fall, and when the team is likely to hit critical milestones like SIT, UAT, regression, and final build.
A Generic Template That Works Everywhere
One of the things I was most deliberate about is keeping this completely generic.
There are no client names hardcoded in. No internal project codes. No company-specific phases baked in that would make it awkward to hand to someone else. Everything — the phase names, the colours, the timeline dates, the sprint configuration — is configurable through the Settings panel.
That means the same file can be used for:
- A large enterprise software rollout across multiple markets
- A small product team running two-week sprints
- A consulting engagement where you need to show a client exactly what’s being delivered and when
- An internal IT project where the stakeholders just want to know “when does UAT start?”
The same tool. The same experience. Every time.
No More Excel Dependency
Let’s talk about the elephant in the room: Excel.
Excel is a fantastic tool. But it was never designed to be a project planning application, and trying to make it one creates a category of problems that are entirely avoidable.
- Formulas break when rows are inserted
- Merged cells cause chaos when someone tries to sort or filter
- The file gets emailed around and nobody knows which version is current
- New starters don’t know how the sheet works and are afraid to touch it
- Opening a complex Excel Gantt on a Mac or in Google Sheets produces a formatting disaster
This tool eliminates all of that. There is one file. It opens in any modern browser on any operating system. It has no formulas to break. It has no version history problem because you save a snapshot whenever you want. And if you do need Excel — for governance, for stakeholders who want a spreadsheet — the export button generates a properly structured XLSX file in seconds.
Privacy First: It Runs Completely Offline
This is something I feel strongly about.
When you’re planning a delivery for a client, the timeline contains sensitive information. Sprint schedules. Feature names. Delivery dates. The kind of things that shouldn’t be flowing through third-party servers just because you needed to update a bar on a chart.
This tool requires zero internet connectivity to function.
Once you have the HTML file, you can:
- Open it on a flight
- Use it on a client site with locked-down Wi-Fi
- Run it on an air-gapped machine if your security policy requires it
- Share it with a colleague who can open it on their laptop without installing anything
There are no analytics pinging home. No cloud sync. No API calls. No cookies. The data never leaves your machine unless you explicitly export it or email the file yourself.
That’s a level of data safety that most SaaS planning tools simply cannot offer — and it costs nothing.
What’s Coming Next: Integration with Story Management Tools
This is where things get exciting.
Right now, you manually add features and configure phase bars. That works well and gives you full control. But the next step is to remove the manual entry entirely by connecting the tool directly to the story management systems your team already uses.
I’m currently working on integrations with tools like Jira, Azure DevOps, Linear, and other popular backlog management platforms. The goal is simple: your epics, features, and sprints already exist in your project management tool. The Gantt chart should be able to read that data and generate the timeline automatically — with the right dates, the right phases, and the right sprint assignments — all in one click.
Imagine opening your planning session, clicking “Sync from Jira”, and seeing your entire delivery timeline populate itself based on the actual data in your backlog. Then you adjust, tweak, and export to Excel for the stakeholder pack. That’s the vision.
No more copying dates from one tool into another. No more timelines that are out of sync with reality before the ink is even dry.
How to Get Started
Getting started takes about thirty seconds:
- Download the HTML file from here
- Open it in Chrome, Firefox, Edge, or Safari
- Click ⚙ Settings to set your start date, sprint length, and configure phases
- Add your features and drag bars to match your plan
- Click 💾 Save as HTML to save your work
- Click ⬇ Export XLSX whenever you need to share a spreadsheet
That’s it. No sign-up. No credit card. No tutorial to watch first.
Final Thoughts
I built this because I was frustrated with the tools available, and because I believe project planning should be fast, visual, flexible, and safe. A single HTML file that runs in your browser, works offline, exports to Excel, and can be configured for any client or project in under two minutes felt like the right answer.
If you’re a project manager, scrum master, delivery lead, or anyone who has ever spent more time formatting a Gantt chart than actually planning the work — I think you’ll find this genuinely useful.
Try it. Customise it. Break it. Tell me what you’d like to see next.
And if you’re interested in the story management integrations when they’re ready, watch this space.

Start the conversation